Starting on July 1st, 2022, the Federal Government requires health insurers and group health plans, including self-funded clients, to publish and update on a monthly basis pricing data in "machine readable formats" for covered items and services based on in-network negotiated payment rates and historical out-of-network allowed amounts. More details can be found here in the CMS Transparency in Coverage Final Rule.
It's not unusual for a service - e.g. brain MRI without contrast - to have different negotiated rates for different providers, even for providers within the same geography, sometimes even for providers within miles of each other. Yet, this data hasn't been available, until now. Most healthcare stakeholders - whether providers, payers, or patients - would likely be interested in consulting this data. In theory at least, this data could change entirely the healthcare industry - from reducing costs, to more access to care enabled by transparency. With a $4.1 trillion annual expenditure in healthcare, healthcare is still one of the few markets where patients are unable to "shop" for a service - just compare the time spent on shopping for a car with the time spent shopping for a hip replacement surgery. Which one of the two do you really want to get right?
This post focuses on providers' perspective. For quite a while, providers have been managing Medicare reimbursement cuts. Commercial insurers generally pay providers substantially higher rates than Medicare does for the same service. Therefore, one of the priorities for providers is often optimizing the reimbursement rates with commercial payers. Yet, transparency across plans, negotiated rates, or competitors has been largely lacking. In theory, the data published as a result of the Transparency in Coverage mandate, may provide a level field.
Here are some examples of data published by insurers as part of the Transparency in Coverage ruling. If interested, at the end of the article is a more comprehensive list of currently available data.
If you have a look at these links, not only are there thousands of files available, but these files are extremely large and in a format that is not easy to understand if you don't have technical expertise. Some of the files are so large, that you may need technical help, just to open them up. Likely, the total size of the data published by the payers would be close to 1 Petabyte (which is 1,024 TB, or 1,048,576 GB). To make things more complicated, the data will be updated by the insurers on a monthly basis. Each insurer has its own data repository published; therefore, if you're a provider, you may need to aggregate data from each plan you're working with, structure it, clean it, and enrich the raw data to prepare for analytics. Talking about BIG DATA, this looks like a major BIG DATA problem.
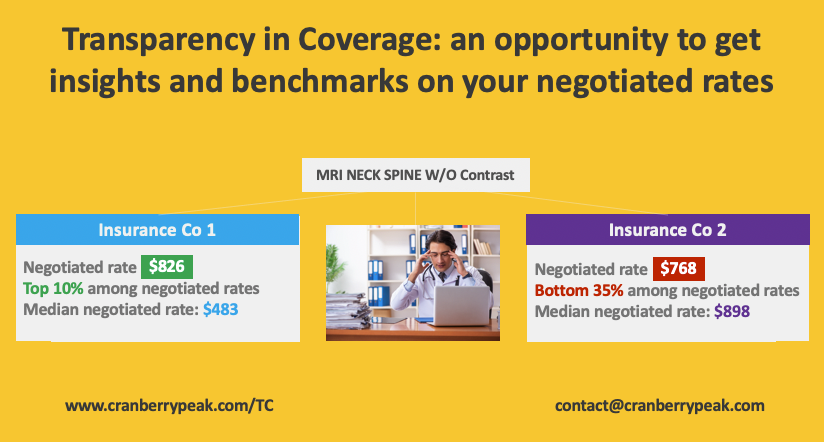
While challenging to digest, the data may be extremely valuable to understand and influence the dynamic of the healthcare market. Here is one example that may be relevant for many providers. For a specific provider, analyzing some of the data available, for the service MRI NECK SPINE W/O Contrast:
Insurance Company 1
Fee-for-service, professional billing in-network negotiated rate for MRI NECK SPINE W/O Contrast:
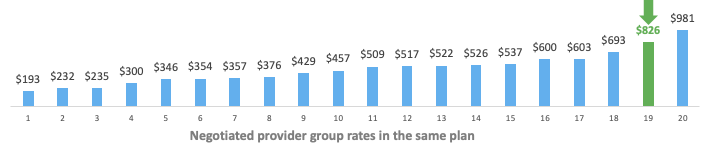
Negotiated rate: $826
Top 10% among negotiated rates
Median negotiated rate: $483
If we look at the negotiated provider group rate distribution for this service, the negotiated rate for this provider is in the top 10% of the negotiated rates.
Insurance Company 2
Fee-for-service, professional billing in-network negotiated rate for MRI NECK SPINE W/O Contrast:
Negotiated rate: $768
Bottom 35% among negotiated rates
Median negotiated rate: $898
If we also look at the negotiated provider group rate distribution for this service for this plan, the negotiated rate for this provider is well below the mean, in fact, in the bottom 35% of all rates.

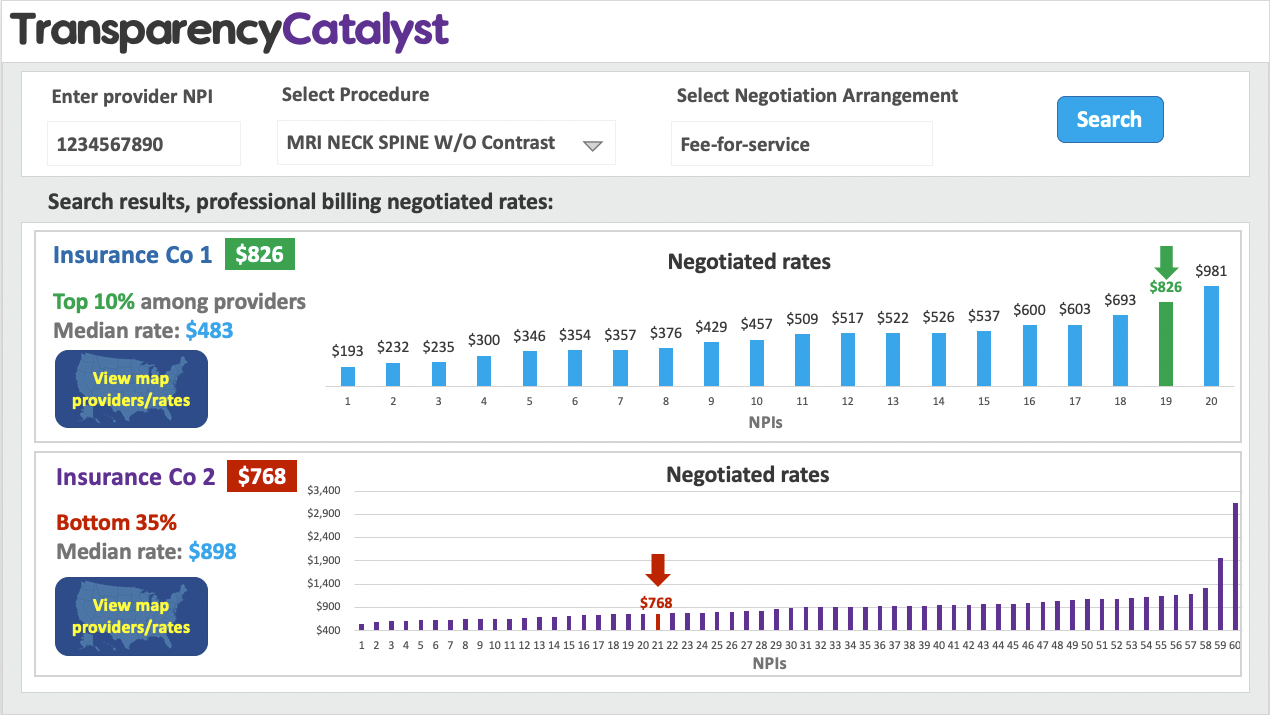
At least based on this example, it seems like this data may provide actionable insights for providers regarding their negotiated rates. Until now while not impossible, this information has been extremely challenging to access across all providers and across all plans.
Clearly this data could shape the healthcare market, if only there would be an easy way to analyze this data. Here is where our company, Cranberry Peak may be able to help. We are working on a new service, called TransparencyCatalyst, that may be able to provide you with insights from this data. More information is available here www.cranberrypeak.com/TC
Please comment on this article and share your thoughts. Whether it's about use cases, various insights that can be valuable for various stakeholders, technical barriers (other than the obvious ones :), or any other thoughts - please do share. Hope we can generate a conversation - this may have an incredible impact on healthcare as we know it.
Please also visit our company's website www.cranberrypeak.com or email us at [email protected]
A collection of "Transparency in Coverage" data published as of Sep 2022 by several payers:
- Aetna: Data Link
- Blue Cross Blue Shield Association: Data Link
- Centene: Data Link
- Cigna: Data Link
- Dean Health Plan: Data Link
- Geisinger: Data Link
- Harvard Pilgrim Health Care: Data Link
- HealthPartners: Data Link
- Humana: Data Link
- Independence Blue Cross Blue Shield: Data Link
- Kaiser: Data Link
- Medical Card System: Data Link
- United: Data Link